How to Calculate Sales Budget: A Complete Step-by-Step Guide
When I first started working with small business owners, I noticed something that surprised me every time. Most of them could tell me how much they hoped to sell, but when I asked how they actually calculated that number, they would go quiet. They had a gut feeling but no real system behind it. That is when I understood why knowing how to calculate a sales budget properly is not optional. It is the foundation every other business decision rests on.
A sales budget answers one straightforward question: how much revenue will we bring in from sales? Once you have that answer, everything else clicks into place. Your production team knows how much to make. Your finance team knows how much cash to expect. Your marketing team has a clear target. But without that first number, every downstream plan is built on guesswork.
Let me walk you through a system that actually works.
What Is a Sales Budget? Why It Is the Foundation of Your Business Plan
A sales budget is a formal estimate of the total revenue your business expects to generate during a specific period typically broken down by product, region, or time period based on projected unit sales and selling price per unit. It is the starting point for every other business budget your organization creates.
Here is why this matters beyond just reporting to investors. Once your sales budget is set, it drives your entire budgeting process. You can calculate how much inventory to produce, how much raw material to order, and how many people you need on staff. Every downstream plan connects to this one number.
I have seen what happens when companies get this wrong in both directions. A budget set too high creates pressure to produce inventory that sits unsold, tying up cash and warehouse space. A budget set too low means missing critical hiring windows and leaving revenue on the table when demand arrives faster than expected. The accuracy of your sales revenue projection does not just affect one department it cascades through the entire organization.
The Two Components Every Sales Budget Needs
Every sales budget, regardless of industry or company size, comes down to exactly two inputs.
First: the quantity your budgeted unit sales, meaning how many units you plan to sell in each period, by product. Second: the selling price per unit. Once you have those two numbers, the rest is straightforward math.
When I sit down with a product-based business, I ask the marketing or sales team a direct question: based on what you know about customer demand, your sales pipeline, and the competitive landscape, how many units can you realistically sell? Then: at what price? The moment those answers are on the table, budgeted unit sales become a calculation rather than a guess.
Quantity comes from your marketing team or sales leadership. They combine past performance data, pipeline analysis, and ongoing market analysis to arrive at a unit volume they can defend with evidence. The selling price is typically set by the finance department in coordination with product management, based on cost structures, target margins, and competitive benchmarking. These two inputs are your foundation.
Sales Budget vs. Sales Forecast: Key Differences Explained
Most people use “sales budget” and “sales forecast” as if they mean the same thing. They do not, and the distinction has real consequences for how your business plans and operates.
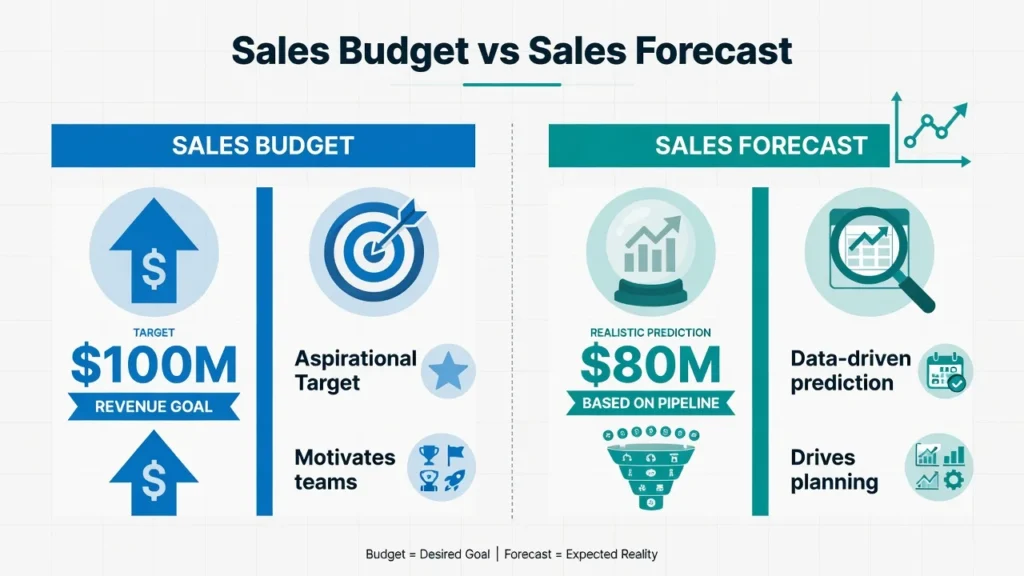
A sales budget is your target the revenue number management commits to pursuing based on strategic growth goals. If leadership wants 30% growth this year, the sales budget reflects 30% more revenue than last year. It is aspirational by design, used to align teams, set performance expectations, and drive compensation structures. The sales target established through the budgeting process gives every team member a shared directional goal to work toward.
A sales forecast is something different entirely. It is a data-driven prediction of what will actually happen, built from your current pipeline, historical close rates, market conditions, and known risks. If your sales budget is $100 million but a careful pipeline review suggests you will close $80 million, your forecast is $80 million. Sales forecast accuracy matters here because downstream decisions hiring, inventory, cash flow need to be grounded in that realistic number, not the aspirational one.
Smart companies track both. The budget creates direction and motivation. The forecast drives operational planning. The gap between them your budget variance is worth measuring every single month, because a widening gap is often the first warning sign that assumptions need revisiting. Why Your Sales Budget Drives Production, Materials, and Labor Planning
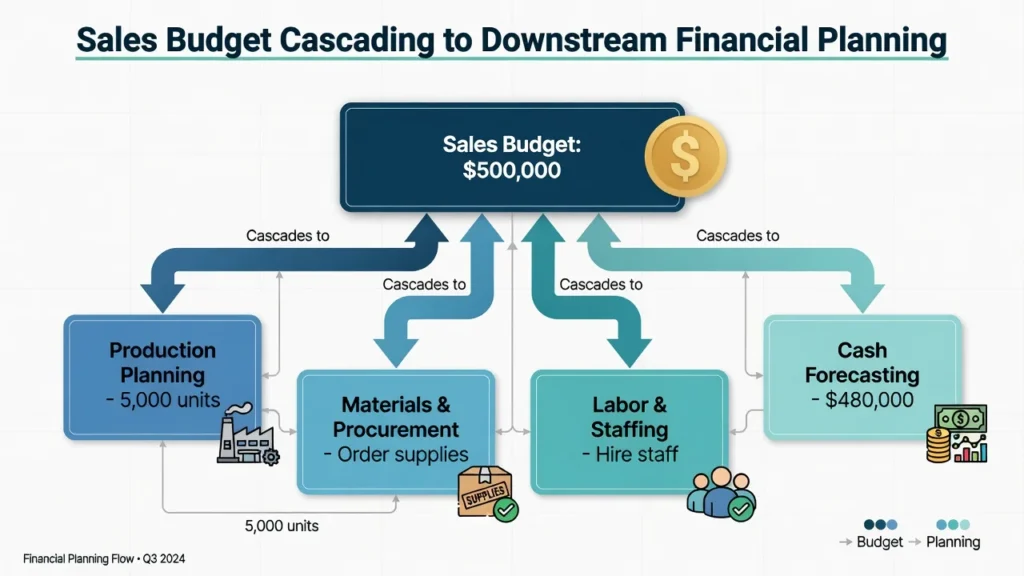
Setting a sales budget triggers a chain reaction that moves through every department in your business.
Here is what that chain looks like in practice. If the sales budget projects 5,000 units for the quarter, production schedules for 5,000 units. Procurement orders raw materials sufficient for that volume. Warehousing prepares capacity to hold and ship it. Labor scheduling determines how many staff hours are needed to produce and fulfill those orders.
The finance team budgets cash for all of it. Every one of these decisions traces back to that one number in your sales budget which is why coordinated small business budgeting across departments is essential.
The financial planning consequences of getting that number wrong run in both directions. Underestimate and you face stock shortages mid-quarter the sales are there but the inventory is not, which means lost revenue, broken customer commitments, and pressure on production to catch up. Overestimate and you are carrying excess finished goods, paying warehouse costs on unsold product, and absorbing labor expenses for work that generated no revenue.
Sales budget accuracy is an operational issue, not just an accounting formality. Every downstream department’s performance depends on the quality of the number you put at the top.
How to Calculate Sales Budget: The Step-by-Step Process
Here is the exact five-step sales budget process I use with clients to move from guesswork to a number you can confidently plan around. Each step in how to calculate a sales budget builds on the one before it skip one, and the final number loses reliability.
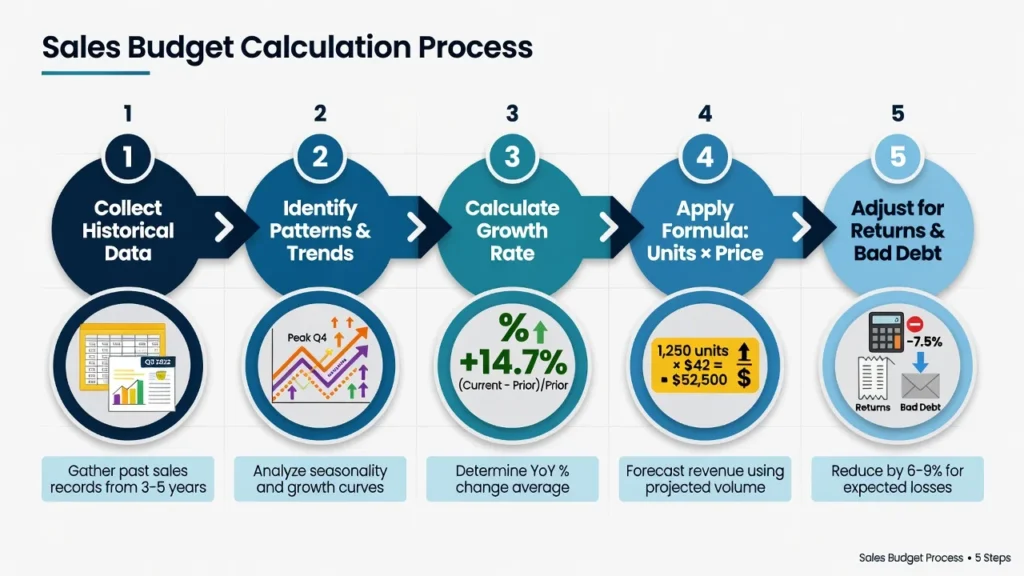
Step 1: Collect Your Historical Sales Data
The first step is gathering your historical sales data the actual performance record that makes everything else in the calculation reliable.
Pull figures from the past two to three years. For each period, collect two numbers: total units sold and total revenue generated. Monthly data is preferable to annual because it captures seasonal variation clearly. Quarterly works if monthly is not available.
When I set this up for a client, I build a simple grid: Year 1, Year 2, and Year 3 across the top, with Q1 through Q4 down the side. Each cell holds units sold and revenue for that period. Within ten minutes, patterns become visible that were invisible in annual summaries.
If your business is brand new and you have no historical sales data to draw from, use the next best alternatives: published industry benchmarks, competitor case studies, or early pilot results. Your assumptions will carry more uncertainty, which means you should build in a wider buffer when setting targets but a well-reasoned estimate is always better than no estimate at all.
Step 2: Identify Seasonal Patterns and Market Trends
With historical data in hand, the next step is identifying the patterns inside it specifically seasonality and sales trend direction.
I worked with a bicycle shop owner whose quarterly numbers told a striking story the moment we laid them out: Q1 had 50 units sold, Q2 jumped to 300, Q3 settled at 200, and Q4 dropped to 100. That is a 6x swing between the slowest and busiest quarter. The cause was obvious summer demand for bikes versus winter. But until we mapped the historical data, she had never quantified just how extreme her seasonality actually was. Her sales budget had to reflect that reality, not smooth over it.
Check your own historical data for the same pattern. Are there months or quarters that consistently outperform or underperform? If yes, you have meaningful seasonality that belongs in your budget. If revenue is genuinely flat across all periods, that is also valuable to confirm.
The second thing to look for is trend direction. A sales trend analysis over three years might show 1,000 units in Year 1 Q1, 1,100 in Year 2 Q1, and 1,210 in Year 3 Q1 a steady 10% annual market growth rate. A business losing ground might show 1,000 dropping to 900 dropping to 810. Both are signals. Knowing which one describes your situation determines whether your upcoming budget should project growth, stability, or a managed contraction.
Step 3: Calculate Your Growth Rate
Most budget builders make a predictable error at this stage: they combine unit volume growth and price increases into a single percentage, and the math becomes unreliable as a result.
Keep these two drivers completely separate. Unit growth means selling more items volume expansion. Price growth means charging more per item a margin lever. They behave differently, they communicate differently to stakeholders, and they compound when multiplied together.
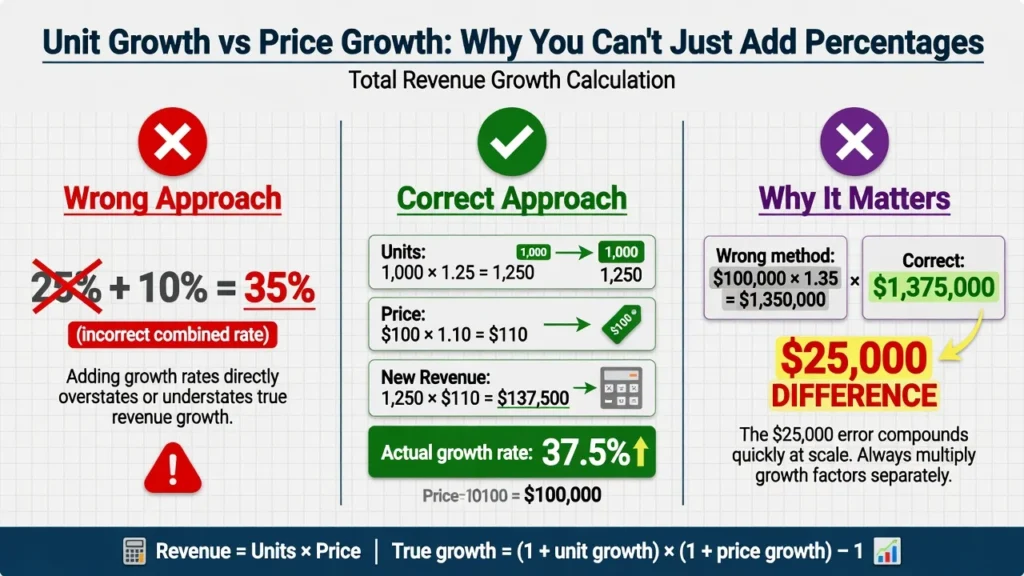
Here is the calculation done correctly. Say last year you sold 1,000 units at $100 each $100,000 in revenue. This year, you expect 25% unit growth and a 10% price increase.
- Units: 1,000 × 1.25 = 1,250 units
- Price: $100 × 1.10 = $110 per unit
- Revenue: 1,250 × $110 = $137,500
Revenue grew 37.5%, not 35% because the two growth rates compound when applied together. By separating them in your calculation, you keep the budget assumptions clear and auditable. When you present this to leadership, they can see exactly how much growth came from selling more volume versus how much came from charging higher prices. Those are two very different stories about the health of your business, and your sales forecast accuracy depends on not confusing them.
Step 4: Apply the Formula : Units × Selling Price for Each Product and Period
This is where the sales budget calculation becomes concrete. For every product and every time period, multiply units by selling price. Do this individually for each product never combine them before calculating.
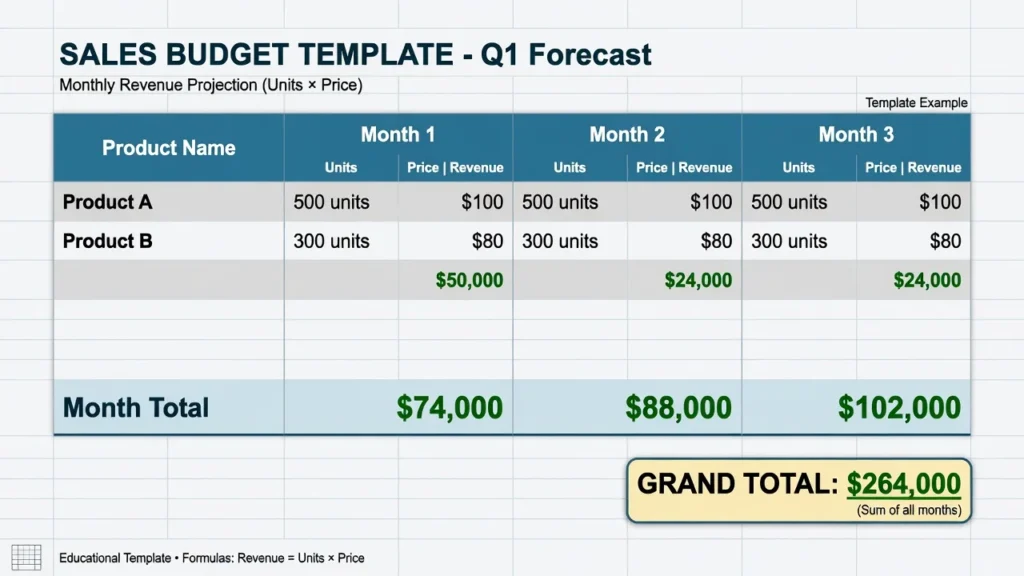
Here is what that looks like with two products budgeted across three months:
Product A:
- Month 1: 500 × $100 = $50,000
- Month 2: 600 × $100 = $60,000
- Month 3: 700 × $100 = $70,000
Product B:
- Month 1: 300 × $80 = $24,000
- Month 2: 350 × $80 = $28,000
- Month 3: 400 × $80 = $32,000
Total by Month:
- Month 1: $74,000
- Month 2: $88,000
- Month 3: $102,000
- Three-Month Total: $264,000
Each product occupies its own row. Each time period occupies its own column. For a business with 10 products and 12 months, this becomes a 10×12 grid 120 individual calculations that together give you a fully auditable, period-by-period picture of how you calculate budgeted sales. The structure is deliberate: when actuals come in, you can compare them to this grid line by line and identify exactly where performance deviated from plan.
Step 5: Adjust for Bad Debts, Returns, and Collections
The gross revenue figure from Step 4 is your starting point, not your final answer. Every business experiences revenue leakage customers who return products, customers who simply do not pay, and discounts that reduce the invoiced amount. You need to build these adjustments into your budget assumptions before the number becomes reliable for planning.
The adjustment rate varies by industry and business model. Based on clients I have worked with and common accounting practice, losses from returns and uncollectible accounts typically run between 2% and 4% of gross revenue though your own historical data is always the best reference point. Retail businesses with liberal return policies often run at the higher end; B2B companies with established customer relationships tend toward the lower end.
Using the $264,000 gross figure from Step 4:
- Adjustment: $264,000 × 0.03 = $7,920
- Net Sales Revenue: $264,000 − $7,920 = $256,080
That $256,080 is your projected net sales the revenue figure used for downstream budget planning.
One important distinction before moving on: net sales revenue is still not the same as cash collected. If your customers pay on 30-day credit terms, revenue you recognize this month will not land in your bank account until next month. That timing gap is addressed through a separate cash collection schedule, which the next section covers in detail.
For businesses that offer volume discounts or promotional pricing, the selling price per unit in your budget should reflect the net realized price after typical discounts not the list price. Using list price when customers routinely pay 85–90% of it will inflate every revenue calculation in the budget.
The Sales Budget Formula: Units × Selling Price
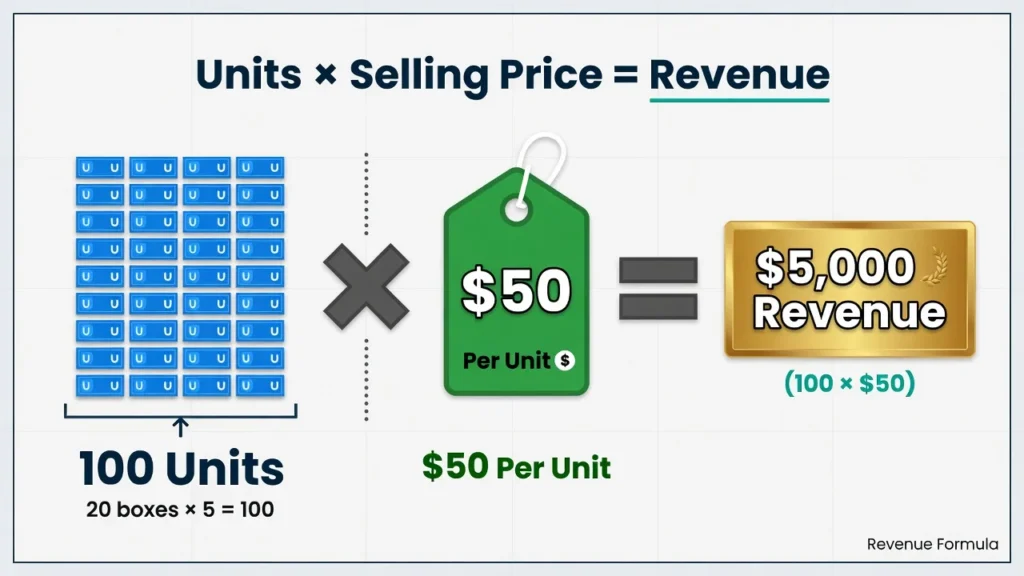
The sales budget formula is straightforward: Units × Selling Price = Revenue. A single calculation. But the real value is not in the arithmetic it is in understanding exactly what this formula measures, what it deliberately excludes, and how to apply it correctly when you have multiple products or credit sales.
Basic Formula : Single Product
If your expected sales volume is 100 units at $50 each, your revenue is 100 × $50 = $5,000. If you expect to sell 1,000 units at $25 each, your revenue is 1,000 × $25 = $25,000.
The formula works because revenue has exactly two levers volume and price. Change either one and revenue moves in direct proportion. Sell more units at the same price and revenue rises. Hold unit volume flat but raise the price and revenue rises. Sell fewer units and revenue falls. The relationship is direct and auditable, which is exactly what makes it useful as a planning tool there is no ambiguity about where a number came from.
Multiple Products : Calculate Each Separately, Then Sum
Most businesses sell more than one product, and that changes how the calculation works.
Never lump multiple products into a single revenue estimate. Calculate each product line separately, then sum the totals. The reason this matters: different products carry different volume profiles and different price points, and combining them before calculating destroys the visibility you need for operational planning.
Product Line Budget for Q2:
| Product | Units | Price | Revenue |
|---|---|---|---|
| Product A | 7,000 | $5.00 | $35,000 |
| Product B | 5,000 | $7.50 | $37,500 |
| Product C | 2,000 | $15.00 | $30,000 |
| Total | $102,500 |
Notice what this breakdown reveals: Products A and B contribute nearly equal revenue despite A selling 40% more units than B. That tells your operations team something specific — they need to produce a high volume of a low-cost item and a lower volume of a higher-value one, which have completely different production and logistics implications. It tells your marketing team which products are growing versus plateauing. And it tells your finance team where margin concentration actually lives. The combined $102,500 number tells none of those stories.
If profit margins vary by product, this format also reveals which products contribute most to the bottom line not just which generate the highest top-line revenue.
Important: This Formula Gives You Revenue, Not Cash
Here is the most important distinction in this entire article, and one of the most commonly misunderstood in business accounting.
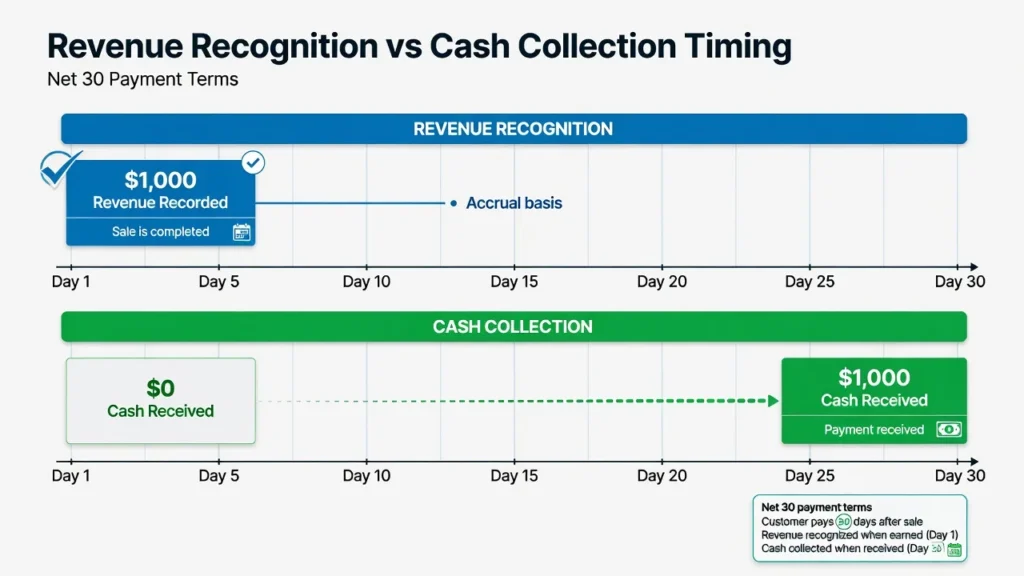
The formula calculates projected revenue the amount your business is entitled to receive from completed sales. Cash is something different: it is the money that has actually landed in your bank account. These two numbers almost never match within the same period.
A concrete example from cash flow planning: I sell you a product today for $1,000. I record $1,000 in revenue immediately. But if your payment terms are Net 30, I will not receive that cash for another 30 days. What I have right now is a receivable a promise, not a deposit.
This is why every business that uses a sales budget also needs a cash budget. The sales budget tracks projected revenue what you have earned. The cash budget tracks when payments actually arrive what you can spend. One is about revenue recognition under accrual accounting standards. The other is about liquidity and solvency.
Under GAAP revenue recognition standards, revenue is recorded when it is earned when the sale is completed and the performance obligation is met not when cash is received. This is why your revenue budget and your cash budget will almost never show the same number for the same period.
I have worked with businesses that showed excellent revenue numbers quarter after quarter and still ran into payroll crises because they confused revenue with cash. They had sold a great deal, but collections had not yet arrived. That distinction between what you have earned and what you have received is one of the most financially consequential things a business owner can understand.
Why $1 Million in Sales Revenue Does NOT Equal $1 Million in Cash
This is one of the most repeated misconceptions I encounter when working with business owners, and it creates genuine cash flow problems when left uncorrected: sales revenue and cash received are almost never the same number in the same period. The size of that gap and whether you account for it determines whether your business has enough cash to operate even when sales are strong.
Understanding Collection Policies and Timing
Most businesses do not collect payment at the moment of sale they extend credit. The terms of that credit are formalized in a collection policy, typically expressed as Net 30, Net 60, or Net 90, meaning the customer has that many days to pay their invoice.
Here is a concrete example. You sell $200,000 worth of products in April under a standard policy:
- 70% collected in the month of the sale
- 25% collected in the following month
- 5% never collected (bad debt write-off)
In April, your income statement records $200,000 in revenue. Your bank account receives $140,000 the 70%. The remaining $50,000 (25%) arrives in May. The $10,000 (5%) is a bad debt loss you will absorb.
Both the $200,000 and the $140,000 are accurate numbers. They are answering different accounting questions. Revenue answers: what did we earn from sales this period? Cash answers: what did we actually receive? Understanding which number you are looking at and why they differ is foundational to sound financial planning.
The Cash Collection Schedule
Tracking revenue is only half of the picture. Every business that sells on credit needs a second schedule running alongside the sales budget one that maps exactly when cash actually arrives, not just when sales are recorded. Companies that maintain only the revenue schedule and not the cash collection schedule are the ones that find themselves short on cash despite showing strong sales figures.
Accounts Receivable Carryover
One of the most overlooked elements in cash forecasting is accounts receivable carryover the money customers owe you from previous periods that will be collected in the current one.
When a period ends with uncollected sales on the books, those amounts do not disappear. They become the opening accounts receivable balance for the next period. If you forget to account for this in your budget assumptions, your Q1 cash forecast will appear lower than it actually is which can trigger unnecessary financing decisions or cause confusion when extra cash arrives unexpectedly.
Real Consequence: Why Working Capital Financing Exists
Here is how this plays out in practice a scenario I have walked through with seasonal businesses multiple times.
Imagine a manufacturer who sells $500,000 in product every September but collects on Net 60 terms. The cash from those September sales does not arrive until November. In October, that company still has to pay its suppliers, its staff, and its overhead but the cash from its biggest month has not landed yet. This timing gap is exactly why working capital lines of credit exist. They are not a sign of financial weakness; they are a tool for managing the structural lag between revenue earned and cash received.
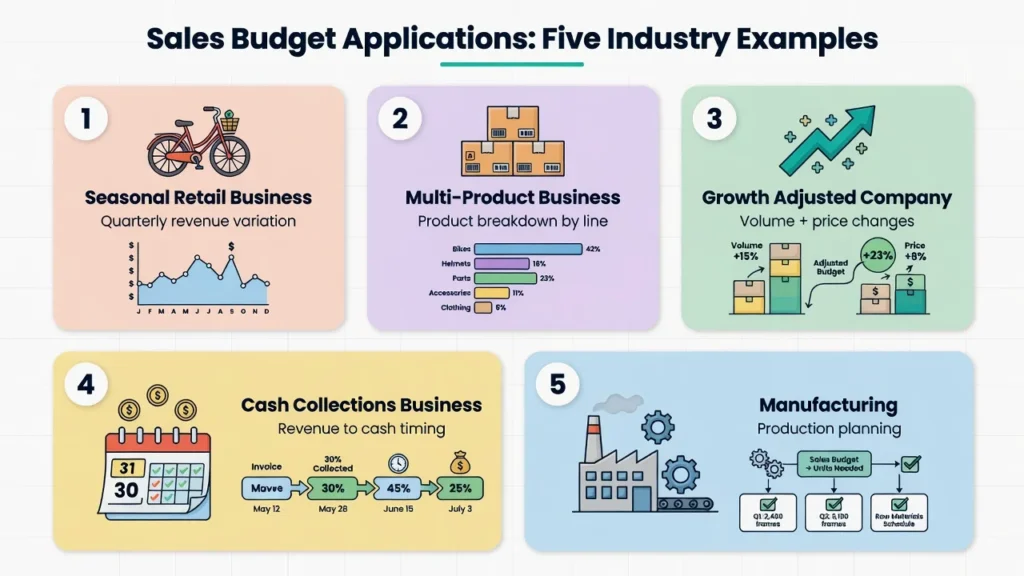
Real Sales Budget Examples : 5 Industries
The most effective way to understand how a sales budget works in practice is to see real sales budget examples across different business types. The five examples below cover seasonal retail, multi-product businesses, growth-adjusted projections, credit collection timing, and manufacturing find the one closest to your situation and apply the same logic to your own numbers.
Example 1: Seasonal Retail Business (Bicycle Shop)
This is the bicycle shop owner I worked with, whose quarterly data revealed extreme seasonality the moment we mapped it out.
Annual Sales Budget:
| Quarter | Units | Price | Revenue |
|---|---|---|---|
| Q1 (Winter) | 50 | $300 | $15,000 |
| Q2 (Spring) | 300 | $300 | $90,000 |
| Q3 (Summer) | 200 | $300 | $60,000 |
| Q4 (Fall) | 100 | $300 | $30,000 |
| Annual Total | 650 | $195,000 |
If she had divided her annual target of $195,000 by 4 and budgeted $48,750 per quarter, Q1 would have shown a 69% miss not because her business was failing, but because the budget ignored reality. Seasonal budgeting keeps the comparison honest.
Example 2: Multi-Product Business (Dages & Forte : fictional products)
Here is what happens when you budget two separate product lines rather than combining them.
Q1 Sales Budget:
| Month | Dages Units | Dages Revenue | Forte Units | Forte Revenue | Total |
|---|---|---|---|---|---|
| January | 7,000 | $35,000 | 5,000 | $37,500 | $72,500 |
| February | 7,000 | $35,000 | 5,000 | $37,500 | $72,500 |
| March | 7,000 | $35,000 | 5,000 | $37,500 | $72,500 |
| Q1 Total | 21,000 | $105,000 | 15,000 | $112,500 | $217,500 |
The combined $217,500 hides the product-level story. Your production team needs to know they are manufacturing 21,000 units of Dages and 15,000 units of Forte not just 36,000 generic units. Those are two completely different production plans. The combined number also hides any diverging trends between the two lines if Dages is growing 10% while Forte is declining 5%, you need to see that before it affects inventory and staffing decisions.
Example 3: With Growth and Price Adjustments (John & Company : hypothetical distributor)
This example shows how to apply Step 3 correctly when both volume and price are changing in the budget year.
Prior Year Results:
- Units Sold: 10,000
- Selling Price: $50 per unit
- Total Revenue: $500,000
Expected Changes for the Budget Year:
- Unit volume increase: 20%
- Price increase: 10%
Budget Year Calculation:
- Budgeted Units: 10,000 × 1.20 = 12,000
- Budgeted Price: $50 × 1.10 = $55
- Budgeted Revenue: 12,000 × $55 = $660,000
Revenue increased 32% not 30% because the two growth rates compound. A budget that simply applies 30% to last year’s $500,000 would produce $650,000, undershooting the correct number by $10,000. Over a full product line with multiple items, that compounding error becomes significant.
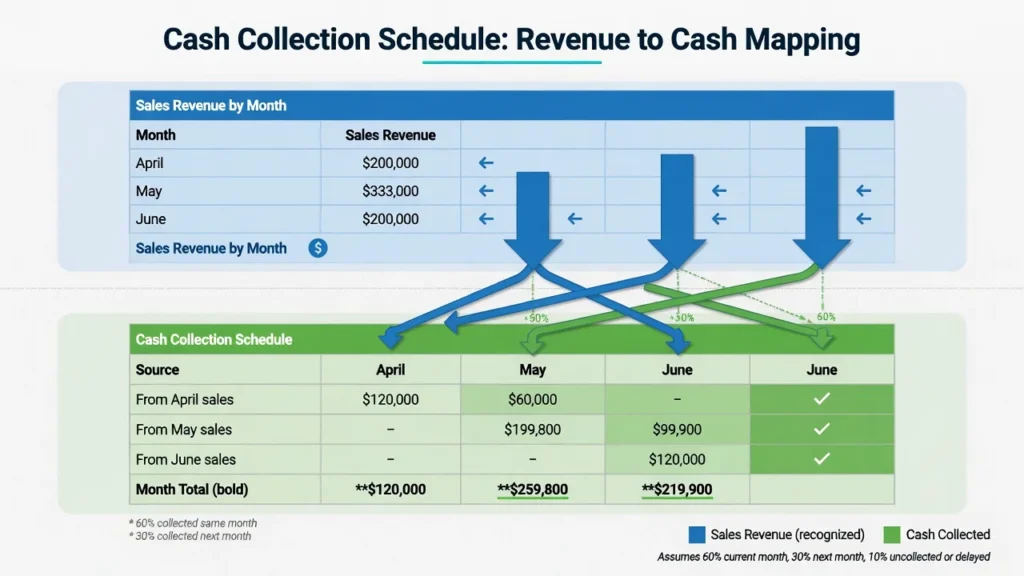
Example 4: Cash Collections Reality (Royal Company)
This monthly sales budget and collection schedule shows the gap between revenue and cash in a single quarter.
Q2 Sales Budget:
- April: $200,000
- May: $333,000
- June: $200,000
- Total Q2 Sales: $733,000
Collection Policy: 60% same month / 30% next month / 10% bad debt
Cash Collection Schedule:
| April | May | June | |
|---|---|---|---|
| From April sales | $120,000 | $60,000 | — |
| From May sales | — | $199,800 | $99,900 |
| From June sales | — | — | $120,000 |
| Cash Received | $120,000 | $259,800 | $219,900 |
Total cash collected in Q2: $599,700 against $733,000 in revenue. The $133,300 difference is a combination of the June receivable carrying into Q3 and the bad debt write-off. Without this schedule, the Q2 cash position looks better than it is.
Example 5: Manufacturing with Seasonal Swings (Potato Chip Company)
This monthly sales budget breaks down the manufacturer’s production and revenue across the quarter.
Q1 Sales Budget:
| Month | Units (bags) | Price | Revenue |
|---|---|---|---|
| January | 10,000 | $2.00 | $20,000 |
| February | 18,000 | $2.00 | $36,000 |
| March | 5,000 | $2.00 | $10,000 |
| Q1 Total | 33,000 | $66,000 |
Collection Policy: 80% same month / 20% following month
Q1 Cash Collected:
- January: $16,000
- February: $32,800
- March: $12,800
- Total Cash: $61,600
The chip manufacturer budgeted for $66,000 in revenue but receives only $61,600 in actual cash during Q1. The remaining $2,000 from March sales carries into April. Production planning, raw material procurement, and payroll for this quarter must be funded against $61,600 not $66,000.
Five Sales Budget Formats: Which One Fits Your Business?
There is no single correct format for a sales budget. Different formats serve different stakeholders and different planning purposes, and most large organizations maintain several simultaneously. Understanding which format to use and when is part of knowing how to create a sales budget that actually gets used by the people who need it.
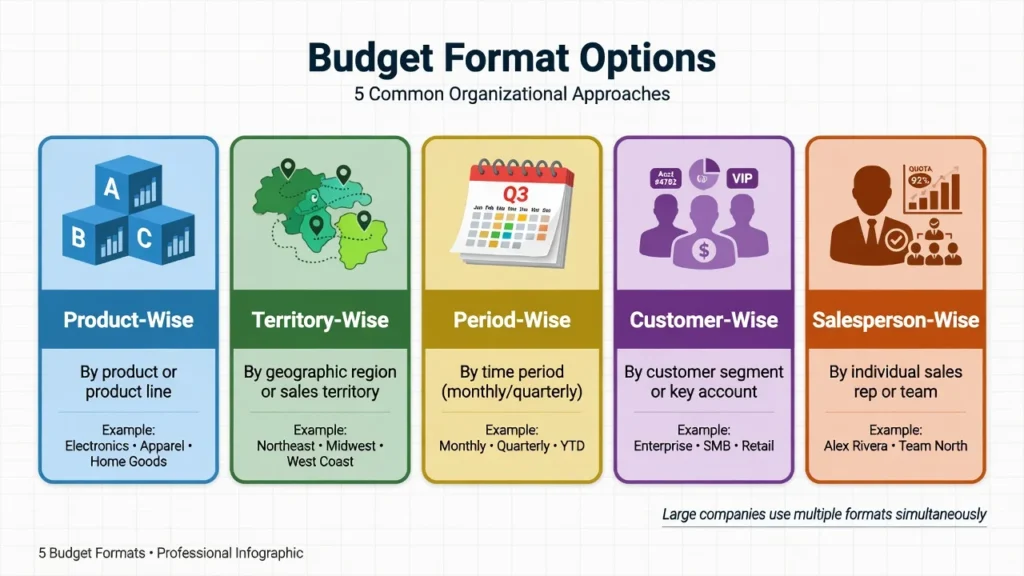
1. Product-Wise Sales Budget
Organizes revenue by individual product or product line. This is the foundation format every other format is built on top of the product-level numbers.
Use this when: you need to track which products are driving revenue growth, when margin analysis by product matters, or when your operations team needs product-level production targets.
If profit margins vary by product, this format also reveals which products contribute most to the bottom line not just which generate the highest top-line revenue.
2. Territory-Wise Sales Budget
Breaks revenue down by geographic region, sales territory, or market segment. Each territory gets its own revenue target, calculated from its own historical data and growth assumptions.
Use this when: you have a distributed sales team, when regional market conditions differ significantly, or when you need to allocate marketing spend by geography.
If East is at 95% of target and West is at 85%, you know exactly where to focus attention and you can investigate the cause rather than averaging it away.
3. Period-Wise Sales Budget
Organizes revenue by time period monthly, quarterly, or annually. This is the format most directly linked to cash flow planning and is essential for any business with meaningful seasonality.
Use this when: cash flow timing matters, when you need to plan inventory purchases by period, or when you are managing a line of credit that fluctuates with seasonal sales cycles.
4. Customer-Wise Sales Budget
Breaks revenue down by customer segment, customer tier, or individual key account. Particularly useful in B2B businesses where a small number of customers represent a large share of revenue.
Use this when: your top 10 customers account for more than 40% of revenue, when contract renewals or upsell targets need to be planned individually, or when customer concentration risk needs to be monitored.
5. Salesperson-Wise Sales Budget
Assigns revenue targets to individual salespeople or sales teams. This is the format that sales management teams use for performance tracking, quota setting, and compensation planning.
Use this when: you have a dedicated sales team with individual quotas, when commission budget calculations need to be tied to individual performance targets, or when you are diagnosing underperformance at the rep level.
Pro Tip: Use Multiple Formats Simultaneously
Large companies do not pick just one format. They create the budget product-wise for product managers, territory-wise for regional teams, and period-wise for cash flow planning. The numbers all tie together and roll up to the same total, but different stakeholders see different breakdowns. They present the same underlying data through different analytical lenses each one answering a different stakeholder question.
How Your Sales Budget Cascades to Production, Materials, and Labor
Your sales budget does not exist as a standalone document. It sits at the top of a cascading financial planning process that determines the size and cost of three downstream budgets: production, materials, and labor.
An error in the sales budget does not stay contained it compounds at every stage of the cascade, making accurate budget calculations at every level essential.
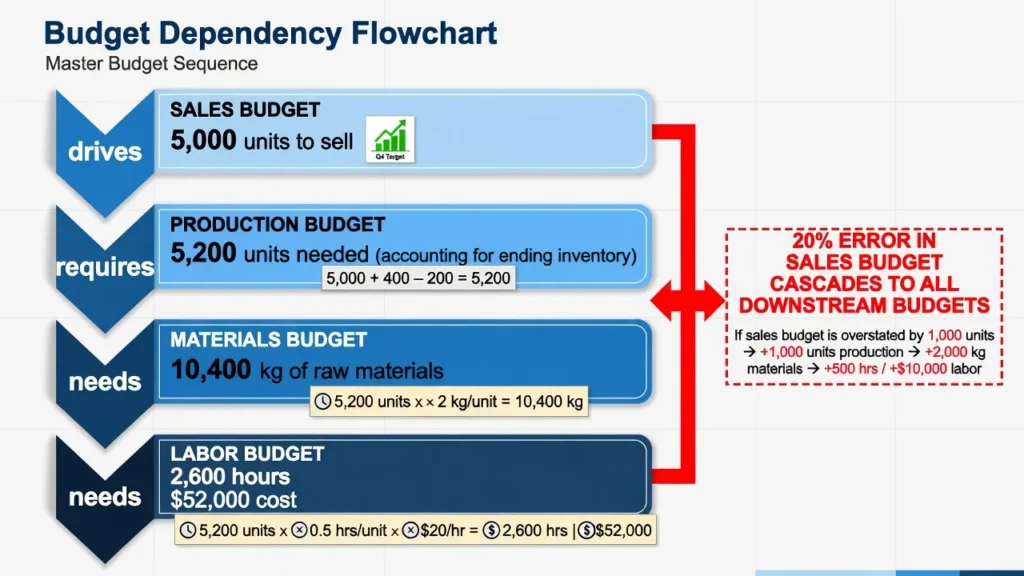
The Production Budget
The production budget answers: how many units do we need to manufacture?
Formula:
Budgeted Production Units = Budgeted Sales Units + Desired Ending Inventory − Beginning Inventory
Example:
- Budgeted Sales: 5,000 units
- Desired Ending Inventory: 500 units
- Beginning Inventory: 300 units
- Production Required: 5,000 + 500 − 300 = 5,200 units
Your production team cannot build this schedule without the sales budget number. It is the first dependency in the cascade.
The Materials Budget
The materials budget answers: how much raw material do we need to purchase?
Formula:
Materials Needed = Production Units × Material Per Unit
Example:
- Production Required: 5,200 units
- Material Per Unit: 2 kg
- Total Materials: 10,400 kg
If the sales budget was wrong by 20% say the correct number was 4,000 units instead of 5,000 procurement would have ordered materials for 5,200 units of production when 4,160 units were needed. That is 2,080 kg of excess raw material, paid for and sitting in a warehouse.
The Labor Budget
The labor budget answers: how many staff hours and what payroll cost does this production volume require?
Formula:
Labor Hours = Production Units × Hours Per Unit Labor Cost = Labor Hours × Hourly Rate
Example:
- Production Required: 5,200 units
- Labor Hours Per Unit: 0.5 hours
- Hourly Rate: $20
- Total Labor Hours: 2,600 | Total Labor Cost: $52,000
This is the chain that makes accurate sales budget planning essential not just for the sales team, but for every department that follows.
Why Getting the Sales Budget Right Matters: The Full Cascade
To understand the full impact, consider what a 20% error in your sales forecast actually costs across the organization:
- Sales forecast error: ±20%
- Production budget error: ±20% (more or fewer units manufactured)
- Materials budget error: ±20% (more or less raw material purchased)
- Labor budget error: ±20% (more or less payroll expense)
If you forecast $1,000,000 in sales but actual results come in at $800,000, the damage extends well beyond a $200,000 revenue shortfall. You are holding excess finished goods that tie up warehouse space and cash. You have purchased raw materials that sit unused. You have paid labor for work that generated no corresponding revenue.
The budgeting process follows a fixed sequence in managerial accounting: sales budget first, then production, then materials, then labor. Each budget is an input to the next. Attempting to prepare a production budget without a finalized sales budget is like calculating a travel budget before deciding where you are going.
This is why the sales budget carries a weight that extends far beyond the sales department. Every downstream team’s accuracy depends on it.
Common Mistakes That Kill Your Sales Budget Accuracy
These are the mistakes I encounter most consistently each one rooted in a concept that was never clearly explained, not in carelessness. Here is how each one happens and how to avoid it.
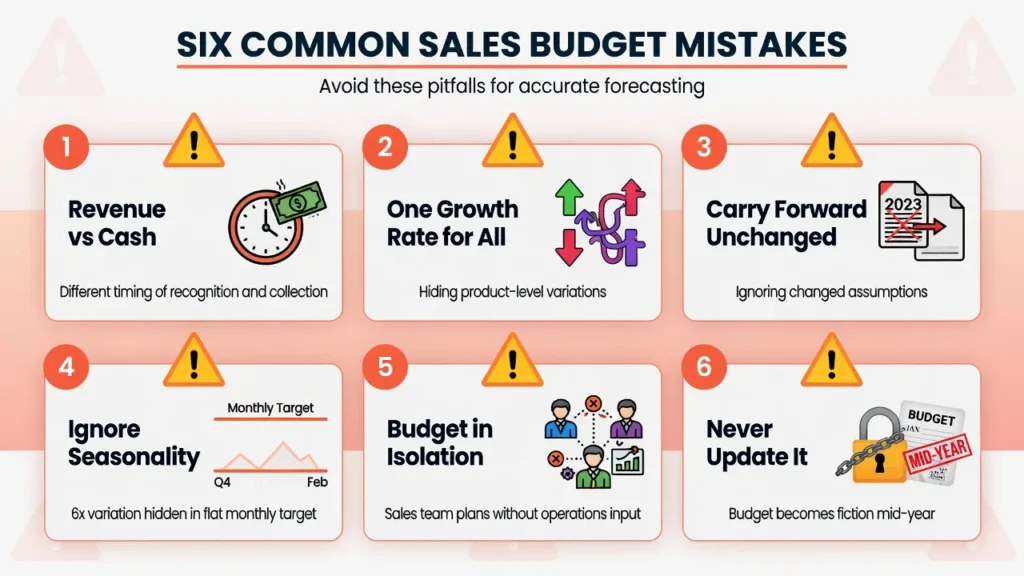
Mistake 1: Confusing Revenue with Cash
You budget $500,000 in sales for Q1 and plan operations around having $500,000 available. But your customers pay on Net 60 terms. In Q1, you collect roughly $300,000 not $500,000. Payroll, supplier invoices, and overhead come due, and you do not have sufficient cash to cover payroll despite having strong sales.
Fix: Pull your accounts receivable aging report for the past 12 months and calculate what percentage of sales was collected in the month of sale versus the month after. That historical pattern becomes your budget assumption for cash collection timing.
Mistake 2: Using One Growth Rate for Everything
You expect 15% revenue growth next year and apply that single percentage to every product, every region, and every quarter equally. But Product A is growing 30% while Product B is declining 5%. The blended rate hides both the opportunity and the problem.
Fix: Calculate growth rates separately by product, by territory, and by period. Blended averages are fine for headline reporting but your working budget needs the disaggregated numbers.
Mistake 3: Carrying Forward Last Year’s Numbers Unchanged
I have seen companies carry last year’s unchanged $500,000 projection forward into a year where the business looked completely different new competitor entered the market, a key account was lost, or pricing changed significantly. The number looks familiar so no one challenges it.
Fix: Every budget cycle, document the assumptions behind the prior year’s numbers and explicitly confirm whether those assumptions still hold. If any assumption has changed, rebuild that number from scratch.
Mistake 4: Ignoring Seasonality
A business with 6x variation between its slowest and busiest quarter sets a flat monthly target of $16,250 (annual $195,000 ÷ 12). Every slow-season month triggers a performance concern that is not actually a performance problem it is a budgeting problem. That produces a budget that is wrong in every period, even if the annual total looks correct.
Fix: Use the percentage of sales method calculate what percentage of annual revenue each historical month or quarter represents, then apply those same percentages to your projected annual total. This keeps each period weighted according to actual historical demand rather than a flat average.
Mistake 5: Setting the Budget in Isolation
The sales team sets the revenue target without consulting operations, finance, or procurement. Operations learns about the budget two weeks before the quarter starts. Procurement has already placed raw material orders based on last year’s volumes.
Fix: Treat the sales budget as a cross-functional document. The sales team provides volume assumptions. Finance stress-tests the price assumptions and ensures operational expenses are accurately captured. Operations confirms whether the production capacity exists to meet the volume target. All three conversations should happen before the budget is finalized.
Mistake 6: Never Updating the Budget After Setting It
The budget is set in December, distributed in January, and never touched again even when Q1 results show that key assumptions were significantly wrong. By Q3, the budget is measuring performance against a fiction.
Fix: Build a formal mid-year budget review into your planning calendar. If actuals deviate from budget by more than 10% in any category, review and update the assumptions driving that category. A budget that is never revised against real-world data stops being a planning tool and becomes a record of outdated assumptions.
How to Handle Special Situations
The standard sales budgeting process assumes you have historical data, stable product lines, and predictable market conditions. When any of those assumptions break down, you need a different approach.
New Products with No Sales History
When I worked with a client launching their first physical product no sales history, no directly comparable competitor we built the budget entirely from a pilot test with 50 customers over six weeks. It was imperfect data, but it was real data, and it gave us a defensible starting point.
If no pilot data exists, use: published industry benchmarks for comparable product categories, competitor case studies or estimated revenues, or conservative market penetration estimates (capturing 0.5–1% of an addressable market is a reasonable starting assumption for a new product).
A conservative sales estimate that you exceed is far more useful than an aggressive one that creates cash flow problems when results fall short.
One methodological note: when launching a genuinely new product or entering a new market where benchmarking is not possible, some finance teams use zero-based budgeting building the entire revenue assumption from scratch using first-principles reasoning rather than adjusting a prior-year baseline. Zero-based budgeting is a budgeting method where every assumption starts at zero and must be justified independently. It is more time-intensive but produces cleaner assumptions when no reliable historical data exists.
Mid-Year Adjustments
A budget set in January should not be treated as immovable if the market shifts significantly. I recommend treating your sales budget as a rolling forecast rather than a fixed annual document — review it quarterly, and if actual results diverge from assumptions by more than 10%, update the forward-looking periods.
A budget that is never updated is not a management tool it is a historical record of assumptions that no longer apply. Treat it as a rolling forecast and it stays useful through the year.
Market Disruptions
If a major competitor enters your market, a key customer is lost, or an economic event changes buyer behavior mid-year, revisit the growth rate assumptions in your budget immediately. Do not wait for the annual review cycle. The value of a budget is not in its precision it is in the decisions it drives. A budget built on broken assumptions drives the wrong decisions.
Tools, Templates, and Implementation: Build Your Budget Now
With the concepts established, here is how to turn them into a working sales budget template and an implementation process your team can follow consistently.
Recommended Template Structure
The sales budget template I return to most consistently follows a simple architecture that keeps the numbers clean and comparisons easy:
Column headers: Product Name | Prior Year Units | Prior Year Price | Prior Year Revenue | Growth Rate (Units) | Growth Rate (Price) | Budget Units | Budget Price | Budget Revenue
Row structure: One row per product per period (monthly or quarterly)
Summary rows: Monthly totals | Quarterly totals | Annual total | Adjustment for returns/bad debt | Net sales revenue
Resist the urge to over-engineer the template. A clean, simple structure gets used. A complex one with too many variables gets abandoned after the first quarter.
Recommended Tools
For small businesses (under $5M revenue): Microsoft Excel or Google Sheets. Both handle the core calculation grid, allow period-by-period comparison against actuals, and are easy to share across departments.
For mid-size businesses ($5M–$50M revenue): Dedicated FP&A tools such as Jirav, Mosaic, or Planful integrate your accounting system data directly, reducing manual entry and making actual-vs-budget comparisons automatic.
For enterprise businesses: ERP-integrated budgeting modules (SAP, Oracle, NetSuite) connect the sales budget directly to production scheduling and procurement, so downstream budgets update automatically when sales assumptions change.
7-Point Implementation Checklist
- Pull historical sales data for the past two to three years, organized by product and period
- Calculate seasonal indices for each month or quarter (each period as a percentage of annual total)
- Document growth rate assumptions separately for unit volume and selling price
- Build the budget grid: one row per product, one column per period
- Apply the adjustment factor for returns and bad debts to arrive at net sales revenue
- Build the cash collection schedule alongside the revenue budget
- Circulate the draft budget to operations, finance, and sales leadership for cross-functional review before finalizing
When to Review and Update Your Sales Budget
Monthly Review
Pull your actual sales figures and build an actual vs budgeted sales comparison line by line, product by product, and period by period. Run a sales budget variance analysis for each product and time period — compare actuals to budget, calculate the percentage difference, and document what caused any variance above 5%. Variances below 5% are typically within normal range. Variances above 10% warrant a formal review of the assumptions driving that category.
Quarterly Review
Use the monthly variance data to assess whether the full-year budget assumptions remain valid. If one quarter has consistently missed budget in the same direction consistently above or consistently below the growth rate assumption that drove the original budget number is probably wrong. Revise it for the remaining quarters and document the change.
Annual Review
At the end of the fiscal year, conduct a full post-mortem on the budget. For every major assumption unit growth rate, price change, seasonal distribution, bad debt rate compare what you assumed to what actually happened. Document the gap and the reason. This becomes the foundation for a more accurate budget in the following year. Each new budget should incorporate the specific lessons from the previous year which assumptions held, which failed, and why so the accuracy compounds over time.
Next Steps: From Sales Budget to Production, Cash, and Financial Statements
The sales budget is complete but it is the beginning of the process, not the end. Here is where revenue forecasting flows into a connected series of operational budgets that together form your company’s complete financial plan.
Your Production Budget answers: how many units do we need to manufacture to meet sales demand while maintaining target inventory levels? It cannot be built without the sales budget.
Your Materials Budget answers: what raw materials do we need to purchase, and when? It cannot be built without the production budget.
Your Labor Budget answers: how many staff hours and what payroll expense does this production volume require? It cannot be built without the production budget. For sales organizations, a related document the commission budget calculates expected sales compensation based on the same revenue projections.
Your Cash Budget : sometimes called the revenue budget converts expected sales revenue into actual cash inflows by applying your collection policy timing. This is the document that answers the question every business owner actually cares about: when will the money be in the account?
Your Income Statement incorporates the net sales revenue line from your sales budget as its starting point, then layers in cost of goods sold, gross profit, operating expenses, and net income.
Once revenue and cost budgets are complete, a break-even analysis uses those numbers to calculate the minimum sales volume your business needs to cover all fixed and variable costs a useful checkpoint before finalizing the budget.
Together, these documents form the master budget the complete financial model of how your business expects to operate over the planning period.
Frequently Asked Questions About Sales Budgets
What is the difference between a sales budget and a sales forecast?
Even experienced finance professionals confuse these two terms I have seen it happen in strategy meetings at companies with eight-figure revenues. A sales budget is a management-set target, built around strategic goals. A sales forecast is a data-driven prediction of what will actually happen. The budget motivates. The forecast plans. The gap between them budget variance is what you measure every month to catch problems early.
How often should I update my sales budget?
Review it monthly against actuals, assess it quarterly for assumption validity, and rebuild it annually. For businesses in rapidly changing markets, a rolling 12-month forecast updated each quarter is more practical than a fixed annual budget. The key principle: a budget that no longer reflects current reality should be updated, not ignored.
Can a small business use a sales budget?
A sales budget is arguably more critical for a small business than for a large one, because small businesses have less financial cushion to absorb planning errors. Even a one-page spreadsheet with monthly unit and revenue projections by product is a sales budget. Start simple. Refine it as you collect more historical data.
What happens if my actual sales are very different from my budget?
Run a sales budget variance analysis immediately. Calculate the percentage difference and identify whether the variance came from volume (sold more or fewer units than planned), price (realized a higher or lower price than budgeted), or both. Document the cause. If the variance reflects a changed market condition rather than a one-time event, update the remaining budget periods to reflect the new reality.
How do I budget for multiple products?
Calculate each product independently its own unit projection, its own price, its own revenue line. Never aggregate products before calculating. After completing the per-product calculation, run a sales budget variance analysis at the end of each month to see which products are tracking ahead or behind budget. That is where the individual product rows in your spreadsheet pay off.
Should I use the same growth rate for every product?
No. Using a single blended growth rate across all products is one of the most common budgeting errors I see. Products in different stages of their lifecycle, sold into different markets, with different pricing dynamics, grow at different rates. Calculate a separate growth rate for each meaningful product category, using its own historical trend and any known market factors specific to it.
Should I use 100% of my sales revenue as cash available for operations?
No. As explained throughout this article, sales revenue and cash collected are different numbers in different periods. Apply your collection policy to your revenue schedule to calculate actual expected cash inflows. Use the cash collection schedule not the revenue budget for operational cash planning. Treating revenue as available cash is how businesses end up unable to cover payroll despite strong sales figures.
Why is the sales budget called the “Mother of All Budgets”?
The nickname captures something real about how financial planning works in practice. Every other budget in the organization production, materials, labor, cash, and ultimately the income statement and balance sheet traces its inputs back to the sales budget. Change the sales budget number and every downstream document needs to be recalculated. It is not just the first budget you prepare; it is the one that makes all the others possible.
This guide covers the complete process for how to calculate a sales budget from historical data collection through the full downstream cascade. Mastering this process is not just a finance skill it is a core operational competency for anyone running or growing a business.