
How to Calculate Budget at Completion (BAC)
If you have managed even one project where costs started drifting without warning, you already know the frustration of not having a reliable number to measure against. That number is the Budget at Completion, or BAC, and knowing how to calculate budget at completion correctly is one of the most practical skills a project manager can have.
BAC is not just a planning figure you set once and file away. It is the benchmark that makes every cost report, performance metric, and budget forecast in your project meaningful. Get it wrong at the start and the damage follows you all the way to closeout. In this guide I cover the formula, the three estimation methods, a complete worked example, and the five mistakes that silently wreck budget baselines before anyone notices.
Budget at Completion Definition: What BAC Actually Means in Project Management
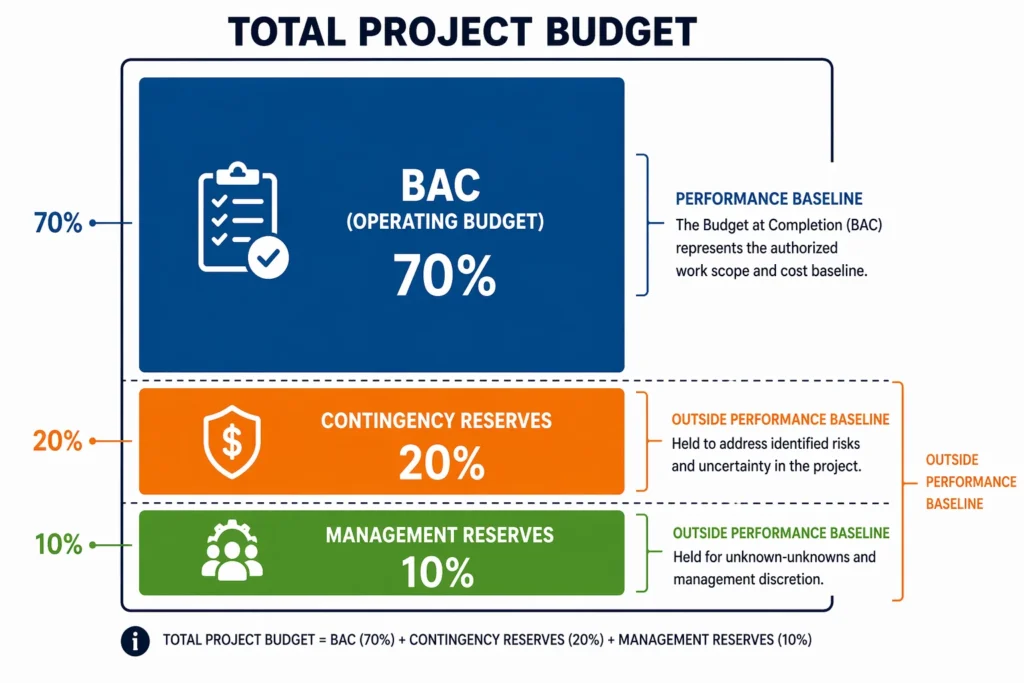
The budget at completion definition is straightforward: BAC is the total authorized operating budget for your entire project. It represents every dollar you planned to spend to deliver all the work, from the first task to the last.
One thing I see get confused constantly, even by experienced project managers: BAC is not the same as your total project budget. The difference matters more than most people realize.
BAC is what you plan to spend on actual project work. Your total project budget is larger because it includes contingency reserves and management reserves on top of that. BAC is purely the operating budget.
In Earned Value Management (EVM), BAC is the anchor metric. The PMBOK Guide defines it as the total authorized budget assigned to a project, established through the cost estimation and budget determination processes.
Every performance number you calculate, including Earned Value, Cost Performance Index, and Estimate at Completion, traces back to it. Remove BAC or distort it and none of those calculations mean anything anymore.
BAC vs Total Project Budget : They Are Not the Same
This is the point I find myself explaining most often, even to project managers with years of experience.
Contingency reserves and management reserves are held completely outside of BAC. They are not included in the number you use for EVM calculations. As risks are realized or scope changes are approved, reserves are formally transferred into the operating budget through an approved process. Only at that point does BAC officially increase.
If you include reserves inside your BAC from the start, every performance metric you calculate will be distorted. Your Cost Performance Index will look better than it actually is because you have padded the denominator. Your Estimate at Completion will appear healthier than reality. The performance measurement baseline you set at project start becomes unreliable from day one.
The cost baseline and scope baseline you establish at project launch should reflect real, authorized work only. Reserves are a safety net, not a padding tool, and they belong outside the performance baseline until formally approved.
The BAC Formula in Project Management: Step-by-Step Calculation Guide
The bac formula in project management is the simplest formula in the entire EVM toolkit:
BAC = Sum of all budgeted costs for all work packages
That is the whole formula. The real skill is not in the arithmetic. It is in building accurate numbers to put into it. That is where I see most projects get into trouble, long before execution even starts.
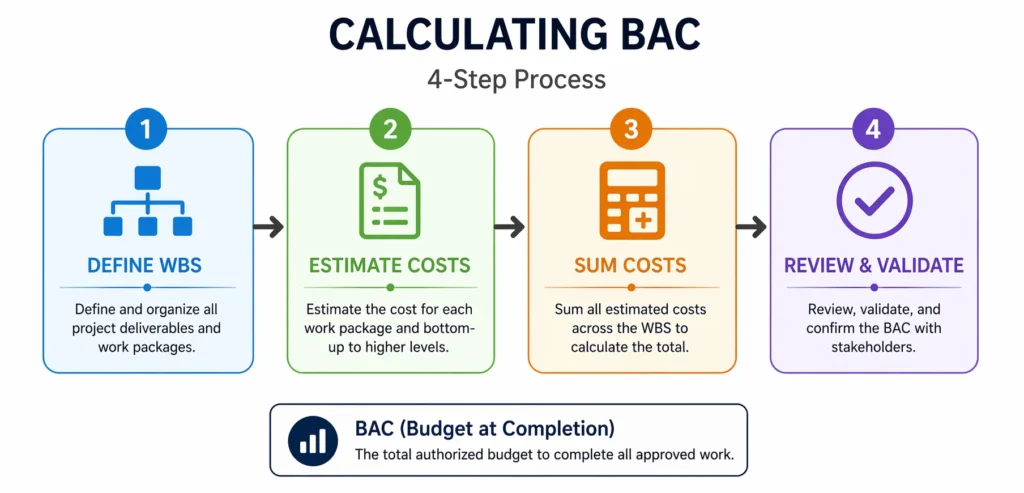
Here is the step by step process I use for BAC calculation:
Step 1: Define your project scope using a Work Breakdown Structure (WBS)
Before you can estimate costs, you need to know exactly what work you are doing. Break the project down into deliverables, then break each deliverable into tasks and work packages. The more detailed your WBS, the more accurate your BAC will be. Do not skip this step or rush it.
Step 2: Estimate the cost of each individual work package
For every task in your WBS, estimate the labor cost, material cost, equipment cost, and any other direct costs. Be specific. A vague estimate at this stage creates a vague BAC, which creates vague performance data later.
Step 3: Sum all the work package costs
Add every individual estimate together. This total is your base project cost. Do a quick line-by-line review as you go rather than adding everything up at the end. Errors are much easier to catch while each number is still fresh.
Step 4: Review and validate the total
Before you call it your BAC, sanity-check the number against available budget, historical data from similar projects, and any constraints identified in project planning. Do not add contingency reserves here. Keep them separate.
A simple worked example:
Imagine you are managing a software development project. Your WBS produces four main work packages with the following cost estimates:
| Work Package | Estimated Cost |
|---|---|
| Requirements and Design | $30,000 |
| Development | $60,000 |
| Testing and QA | $20,000 |
| Deployment and Documentation | $10,000 |
| BAC | $120,000 |
Your BAC is $120,000. That is your authorized budget for project work.
This is where the number starts earning its keep. If your project is 20% complete, your Planned Value at that point is $120,000 x 20% = $24,000. That $24,000 is the value of work that should have been done by now according to your plan. Every EVM calculation you run from this point traces back to that original $120,000 BAC.
3 Proven Methods to Set Your BAC Before the Project Starts
This method works best when you have a fully defined scope and enough detail to cost each activity accurately. It takes more time than the other methods, but it produces the most reliable result because it relies heavily on expert judgment from team members who understand the actual work being performed.
Bottom-Up Estimating: The Most Reliable Way to Build Your BAC
Bottom-up estimating is the gold standard for BAC calculation. You start with your Work Breakdown Structure and estimate the cost of every individual task from the ground up. Then you roll all those individual estimates into a single total.
This estimation technique works best when you have a fully defined scope and enough detail to cost each activity accurately. It takes more time than the other methods, but it produces the most reliable result because it relies heavily on expert judgment from team members who understand the actual work being performed.
Separating costs into categories ensures nothing gets missed in your resource allocation plan. A thorough bottom-up estimate typically covers:
Labor (man-days, hourly rates, craft types) Equipment and rentals Materials Subcontractor costs Expenses and overhead
In construction projects I have seen this approach save projects from significant budget shortfalls. Separating costs into categories ensures nothing gets missed in your resource allocation plan. A thorough bottom-up estimate typically covers:
Labor (man-days, hourly rates, craft types) Equipment and rentals Materials Subcontractor costs Expenses and overhead
Going through each category separately forces you to think through every cost driver one at a time. I have reviewed plenty of lump sum estimates that looked reasonable until someone asked where the equipment rental budget was. Category by category is the only way to catch those gaps before they show up as surprises mid-project.
For budget allocation purposes, this level of detail also makes it much easier to track actual costs against specific budget lines during execution.
Analogous and Parametric: When Speed Matters More Than Precision
Sometimes you need a BAC estimate quickly, and you do not have a detailed scope yet. That is where analogous and parametric estimating come in.
Analogous estimating is an estimation technique that means using data from similar past projects as your reference point. If you built a comparable software system two years ago for $200,000, you might estimate this new project at a similar figure, adjusted for scope differences. It is a top-down approach and it is fast.
The tradeoff is accuracy. Analogous estimating works reasonably well in early planning when you just need a ballpark number to get stakeholder buy-in or initial budget approval. But I would never use it as the sole basis for an execution-stage BAC. Too much can differ between projects even when they look similar on the surface.
Parametric estimating takes a different approach. It uses statistical relationships and unit costs to build the estimate. A construction example would be: if you know a particular type of work costs $85 per square foot and you need 5,000 square feet done, your parametric estimate is $425,000. This method is highly reliable for repeatable, measurable work where unit cost data is available.
Both methods are useful tools in early project planning and for budget forecasting in the absence of detailed scope. Neither should replace a full bottom-up estimate once your scope is defined.
Why BAC Must Be Fixed : and What Happens When You Change It
Here is something I wish someone had explained to me clearly early in my project management career: BAC is not a number you update whenever things get uncomfortable. It is a performance baseline, and its entire value comes from staying fixed.
Once you set your BAC and your project begins executing, every EVM metric you generate is a comparison against that original number. Your Cost Performance Index tells you how efficiently you are spending money relative to BAC. Your Estimate at Completion forecasts what the project will cost compared to BAC. Your Variance at Completion shows how far over or under BAC you expect to finish.
All of that only makes sense if BAC holds steady.
When project managers change BAC informally, without going through a formal change request, they destroy the integrity of every historical comparison they have made. Your CPI trends become meaningless because the denominator shifted underneath them. Past performance reports are no longer comparable to anything you produce going forward. Essentially you lose the ability to tell whether the project is genuinely improving or whether someone just moved the goalposts to make it look that way.
The project controls framework exists precisely to prevent this. If a real scope change happens and it gets formally approved, then yes, BAC is updated to reflect the new authorized work. That is the right process. You document the change, you get approval, and you update the cost baseline, scope baseline, and performance measurement baseline together. The project baseline changes as a formal, documented event.
But changing BAC because you are over budget and want the metrics to look better? That is not project controls. That is covering up a problem that will catch up with you.
The same principle applies to reserves. The same logic applies to reserves they stay outside BAC until formally approved for transfer. Only then are they formally moved into the operating budget with authorization. This keeps your project baseline clean and your performance data trustworthy.
How BAC Fits Into Earned Value Management (EVM)
BAC does not live in isolation. It is the foundation of the entire Earned Value Management framework. Every other EVM metric either uses BAC directly in its formula or derives from a metric that does. Once you see those connections laid out, the whole system makes far more sense.
BAC does not live in isolation. It is the foundation of the entire Earned Value Management framework. Every other EVM metric either uses BAC directly in its formula or derives from a metric that does. The most critical completion calculations in EVM your forecasts for Estimate at Completion, Estimate to Complete, and Variance at Completion all trace back to your BAC. Once you see those connections laid out, the whole system makes far more sense.
Earned Value Management is a methodology for measuring project performance by comparing planned work, completed work, and actual costs. BAC is the total authorized budget that anchors this whole system.
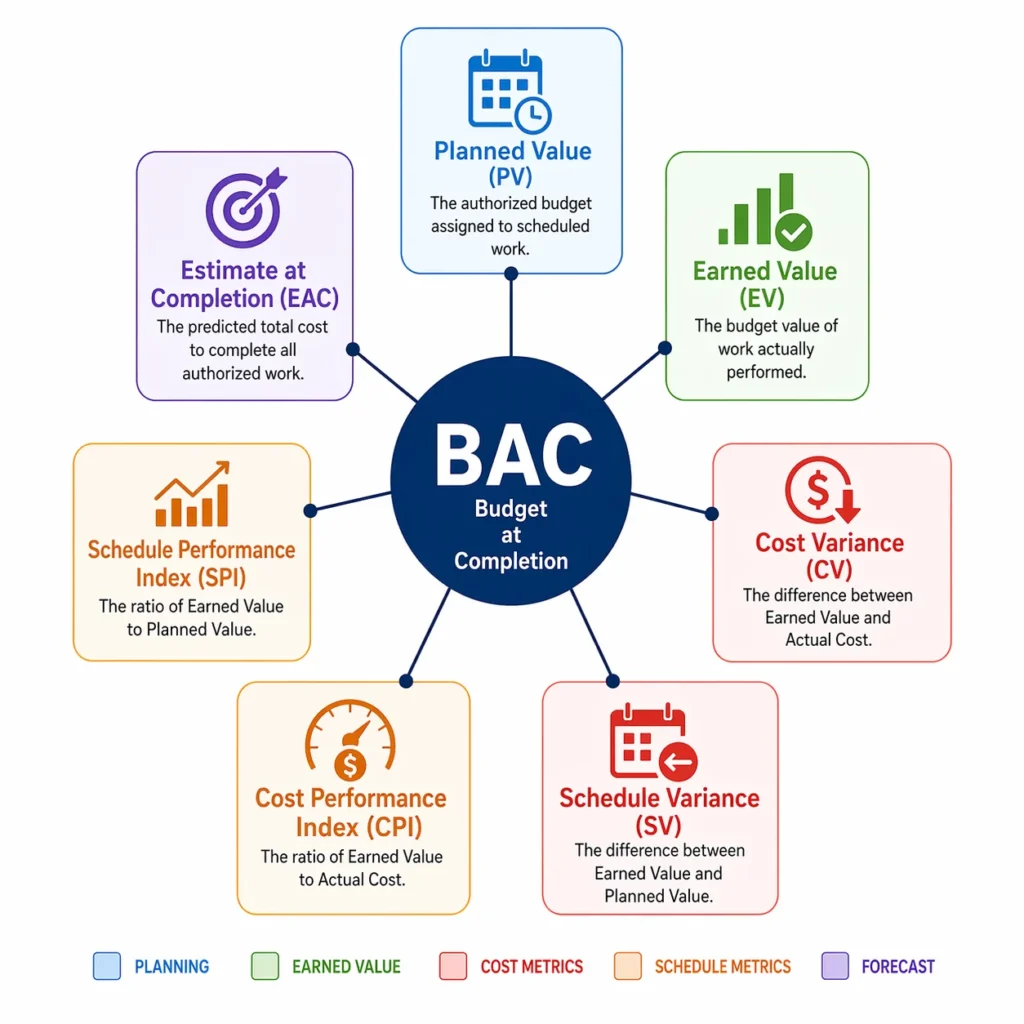
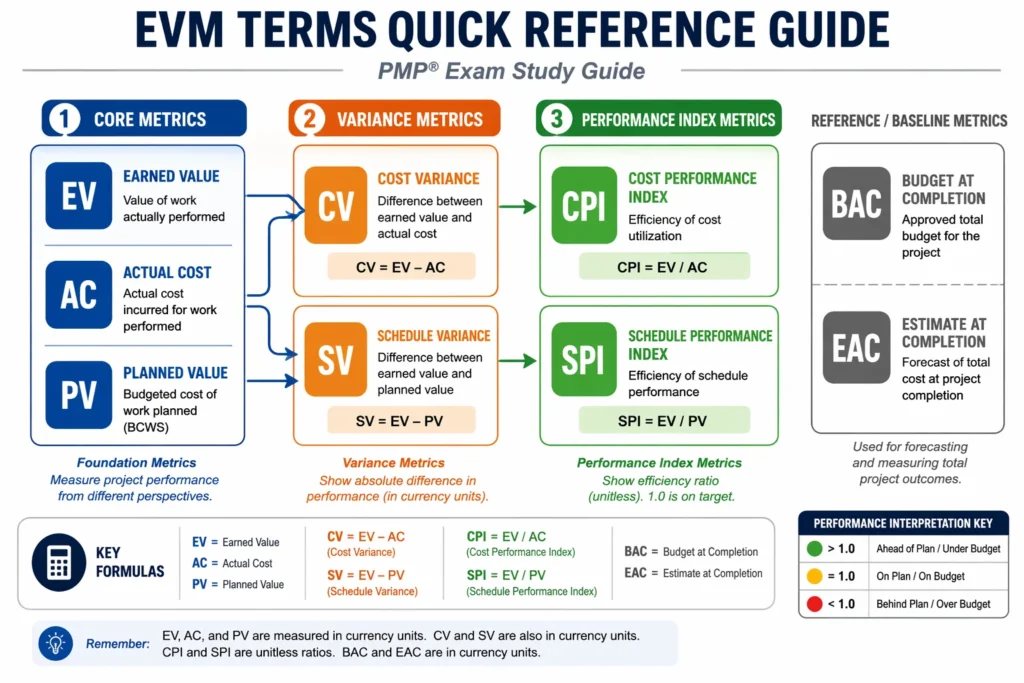
Here is how BAC connects to the core EVM metrics:
| Metric | Formula | What It Tells You |
|---|---|---|
| Planned Value (PV) | BAC x % planned complete | Budget for work scheduled to date |
| Earned Value (EV) | BAC x % actual complete | Budget for work actually done |
| Cost Variance (CV) | EV minus AC | Are you over or under budget? |
| Schedule Variance (SV) | EV minus PV | Are you ahead or behind schedule? |
| Cost Performance Index (CPI) | EV divided by AC | How efficiently are you spending? |
| Schedule Performance Index (SPI) | EV divided by PV | How efficiently are you progressing? |
| Estimate at Completion (EAC) | BAC divided by CPI | What will the project actually cost? |
Notice that BAC appears directly in the EAC formula and indirectly in everything else, since PV and EV are both percentages of BAC. That is why a bad BAC corrupts the entire system.
On an EVM performance chart, BAC has a specific visual meaning. It is the endpoint of the Budgeted Cost of Work Scheduled (BCWS) or Planned Value line. When you read that line on a chart, the horizontal axis shows you when the project is scheduled to finish, and the vertical axis at that final point shows you the total authorized budget. That endpoint is BAC. It is literally where your plan is supposed to arrive.
The Actual Cost of Work Performed (ACWP) and Earned Value lines are tracked alongside the Planned Value line throughout the project. How those three lines relate to each other at any given moment tells the full story of cost performance and schedule performance against the original plan.
5 BAC Mistakes That Silently Wreck Your Budget Baseline
I have seen these mistakes made on real projects by people who knew what BAC was but still got tripped up in practice. None of them are obvious from a textbook. They tend to creep in during the setup phase before anyone realizes the damage is done.
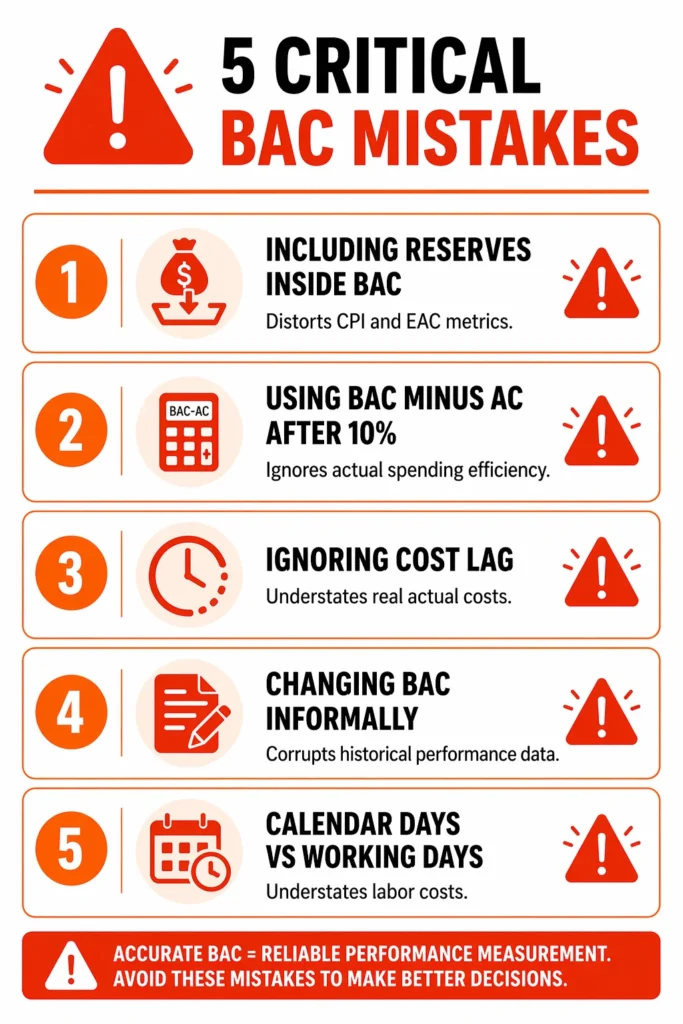
Mistake 1: Including reserves inside BAC
I already touched on this but it is worth repeating because it is so common. When you include contingency or management reserves in your BAC figure, your CPI looks better than reality and your EAC appears more optimistic than it should be. Budget management becomes compromised from the start because you are measuring performance against a padded baseline. Keep reserves out of BAC. Always.
Mistake 2: Using BAC minus AC as your ETC after the project is underway
The formula ETC = BAC minus AC is technically valid, but EVM practitioners and PMP training materials generally treat it as reliable only in the first 5 to 10 percent of project completion. After that point, this formula simply tells you how much money is left in the budget. It completely ignores how efficiently you have been spending that money.
If your CPI is 0.80, meaning you are only delivering 80 cents of value for every dollar spent, then your remaining budget will not go as far as the simple subtraction suggests. Using BAC minus AC beyond the early stage gives you a false picture of what completion will actually cost. Variance analysis using this formula past that threshold is misleading.
Once your project is past the 10 percent mark, switch to ETC = (BAC minus EV) divided by CPI. This formula accounts for how your project has actually been performing and gives you a realistic cost-to-complete figure.
Mistake 3: Ignoring cost lag in your financial data
This one is particularly common in construction and large capital projects, and it is one of those project finance realities that textbooks never quite prepare you for. Your financial reports always trail reality by some amount of time, whether that is days or weeks. Costs incurred since the last report cut off are real and they are accumulating, but they are not showing up in your costs on the books yet.
If you build your remaining budget estimate without accounting for this lag, you are starting from an understated actual cost. Your remaining budget looks larger than it really is. Expenditure tracking needs to account for costs that have been incurred but not yet recorded. Before finalizing any cost to complete estimate, identify what costs you know have been spent since the last reporting period and include them in your current actual cost figure.
Mistake 4: Changing BAC informally without a change request
This happens when a project is running over budget and someone decides to quietly revise the BAC upward to “normalize” the metrics. The CPI suddenly improves on paper. The EAC looks healthier. Budget performance appears to stabilize.
What actually happened is that the project cost baseline was corrupted. Historical performance data is now incomparable to current data. Any trend analysis you do from this point forward is worthless because the baseline shifted midstream. Formal change control is not bureaucracy. It is the mechanism that keeps your performance data meaningful.
Mistake 5: Estimating labour costs on calendar days instead of working days
When estimating remaining labor costs, always calculate based on actual available working days, not calendar days. Weekends, public holidays, and scheduled downtime are not billable labor days. If your estimate assumes 20 working days in a month but the calendar shows only 17 actual working days after holidays, your labor cost estimate will be understated from the start. Project cost management requires this level of precision in the setup. Build a working day calendar specific to your project before you finalize any labor-based cost estimates.
Budget at Completion vs Estimate at Completion : What’s the Difference?
The budget at completion vs estimate at completion question comes up in almost every EVM training conversation I have had. They are related metrics that people routinely conflate, and the confusion tends to produce bad forecasting decisions. The distinction is actually simple once you anchor it to one core idea.
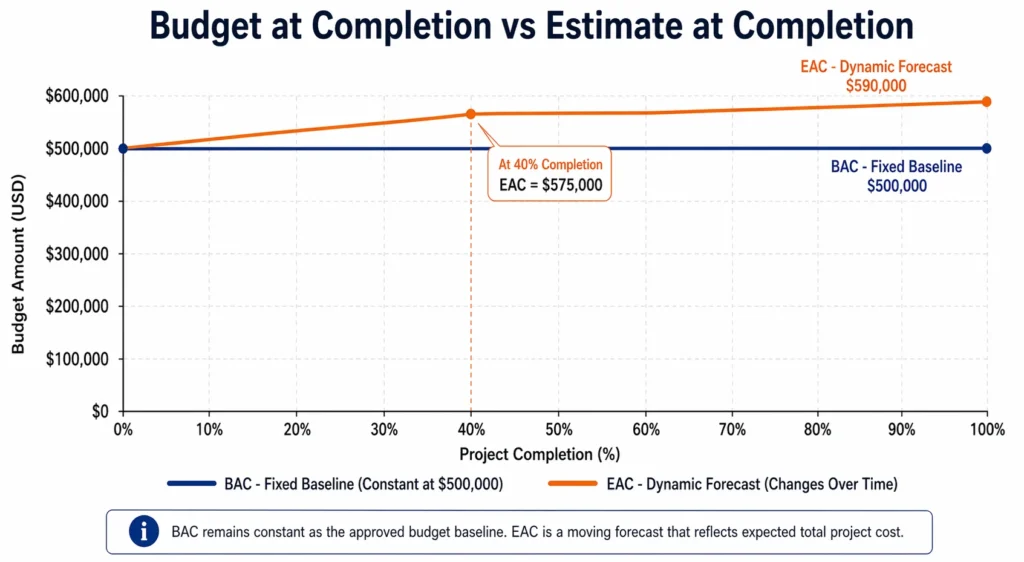
BAC is fixed. EAC is dynamic.
BAC is the original approved budget for your project. You set it during planning and, absent a formal change, it stays exactly where you put it for the life of the project. It represents what you planned to spend.
The Estimate at Completion (EAC) is your current forecast of what the project will actually cost when all work is finished. It changes as the project progresses and new performance data comes in. It represents what you now expect to spend based on how things are actually going.
The relationship between the two tells you something critical. When EAC equals BAC, your project is tracking to finish at exactly the original budget. When EAC exceeds BAC, you are projected to overrun. When EAC is below BAC, you expect to come in under budget.
How to calculate EAC from BAC:
The most common formula for calculating EAC in project management is:
EAC = BAC divided by CPI
This formula assumes that the spending efficiency you have experienced so far will continue for the rest of the project. If you have been overspending, it assumes that will continue. If you have been underspending, same assumption.
The financial stakes become very concrete with actual numbers. Take a project with a BAC of $100,000. At the current checkpoint, your Earned Value is $60,000 but your Actual Cost is $70,000, which equals 0.857.
Now apply the EAC formula: $100,000 divided by 0.857 = approximately $116,750.
Your EAC now exceeds your BAC by over $16,000. That is your projected budget overrun if performance does not improve. That number is not a surprise at project end. It is a signal you can act on right now.
For a more complete picture that accounts for both actual costs to date and remaining work performance, use:
EAC = AC plus (BAC minus EV) divided by CPI
This version takes what you have already spent and adds a performance-adjusted estimate for the remaining work. It is more precise than the simplified formula because it separates what is done from what is left.
What about Variance at Completion (VAC)?
VAC = BAC minus EAC. A negative VAC means you are projected to finish over budget. A positive VAC means you expect to come in under. This is a useful single-number summary for stakeholder reporting and budget forecasting at the portfolio level.
The budget variance between what you planned and what you are now forecasting is exactly what BAC and EAC together help you quantify and communicate.
When to Use Budget at Completion (and When It Stops Telling the Whole Story)
BAC is genuinely useful, but it answers one specific question: how does current performance compare to the original plan? It cannot answer everything. Here is where it belongs in your workflow and where you need to pair it with other data.
The three primary use cases for BAC are:
1. As the baseline for EVM performance reporting
Every EVM performance report you produce references BAC. It is the constant benchmark for budget status reporting, progress tracking, and calculating Earned Value, CPI, and SPI. It stays in the formula from first report to final closeout.
2. As the input for EAC and ETC forecasting
Every time you forecast what the project will cost at completion, BAC is in the formula. Whether you use BAC divided by CPI or the more complete performance-based formula, BAC is always the starting point for cost forecasting.
3. As the benchmark for project closeout
When the project finishes, the final comparison is always actual cost versus BAC. How close did you come to the original authorized budget? The answer forms part of lessons learned documentation and provides reference data for estimating similar future projects.
Where BAC stops telling the full story:
This is where a lot of well-intentioned budget reporting falls apart. A project can appear to be on budget based on AC versus BAC and still be in serious trouble.
Imagine a project where actual cost has consumed exactly half of BAC at the halfway point in the schedule. Looks fine, right? Now imagine that only 30 percent of the work has actually been completed. Your Earned Value is far below your Planned Value. You have spent correctly in dollar terms but underdelivered significantly in work terms.
BAC alone could not have told you that. You need Earned Value alongside it. BAC without EV is like measuring how far you have driven without checking whether you are on the right road. Budget performance must always be read alongside schedule performance index and Earned Value to give a complete picture.
BAC in Agile and hybrid environments:
In traditional waterfall projects, BAC is locked at project start and held firm. In Agile environments, things work a little differently. Sprint-based projects often revise their overall project budget at each major release planning cycle as scope becomes clearer. The concept of BAC still applies but it may be re-baselined at defined checkpoints rather than treated as permanently fixed.
This does not mean Agile projects have no budget discipline. It means that project controls in Agile require a different cadence and a clear governance process for when and how budget revisions are formally approved. Portfolio management across multiple Agile projects requires particular attention to how BAC is defined and managed at the program level.
BAC in a Real Project: A Complete Worked Example
Theory only takes you so far. Here is a full scenario from setup to mid-project performance analysis using real numbers.
Project: Office Building Renovation Original BAC: $500,000
How BAC was set:
At project start, the project manager used bottom-up estimating based on a full WBS. The cost breakdown looked like this:
| Category | Estimated Cost |
|---|---|
| Labor | $180,000 |
| Equipment and Rentals | $75,000 |
| Materials | $160,000 |
| Subcontractors | $60,000 |
| Overhead and Management | $25,000 |
| BAC | $500,000 |
Contingency reserves of $40,000 were held separately outside BAC.
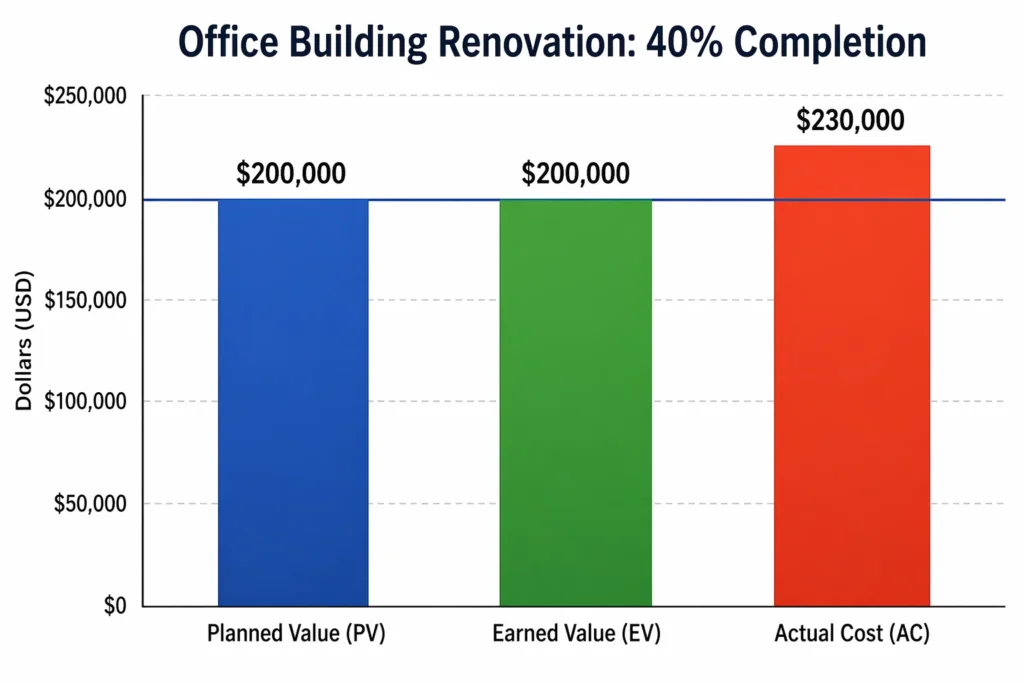
At the 40% completion point:
The project is 40% complete. According to the project schedule, it should also be 40% complete at this point in time.
Here is the performance data:
- Planned Value (PV) = $500,000 x 40% = $200,000
- Earned Value (EV) = $500,000 x 40% = $200,000 (work is on schedule)
- Actual Cost (AC) = $230,000 (more was spent than planned)
Calculating CPI:
CPI = EV divided by AC = $200,000 divided by $230,000 = 0.87
This tells us that for every dollar spent, only 87 cents of value is being delivered. The project is behind on cost efficiency even though it is on schedule.
Calculating EAC:
EAC = BAC divided by CPI = $500,000 divided by 0.87 = approximately $574,700
That is a projected overrun of $74,700 above the original BAC of $500,000. Importantly, this is identified at 40% completion, not at 90% when it is too late to act.
What this means in practice:
The cost performance signal at 40% allows the project manager to take corrective action now. Review labor costs, renegotiate subcontractor rates, identify where budget allocation is out of line, or initiate a formal change request if scope has grown.
That is exactly what knowing how to calculate budget at completion is designed to give you: a real signal early enough to do something about it. At 90% complete, a $74,700 projected overrun is just a number you report. At 40% complete, it is something you can still fix.
Quick BAC Reference for PMP Exam Prep
If you are studying for the Project Management Professional (PMP) exam, BAC is a topic you will encounter repeatedly. EVM questions make up a significant portion of the exam and knowing how to calculate budget at completion, apply its formulas, and interpret results is non-negotiable for a passing score.
Key Terms Every PMP Candidate Must Know:
| Term | Abbreviation | What It Means |
|---|---|---|
| Budget at Completion | BAC | Total authorized budget for all project work |
| Estimate at Completion | EAC | Current forecast of total project cost |
| Estimate to Complete | ETC | Forecasted cost to finish remaining work |
| Actual Cost | AC | Total cost spent to date |
| Earned Value | EV | Budgeted value of work actually completed |
| Planned Value | PV | Budgeted value of work planned to date |
| Cost Variance | CV | EV minus AC (negative = over budget) |
| Schedule Variance | SV | EV minus PV (negative = behind schedule) |
| Cost Performance Index | CPI | EV divided by AC (below 1 = overspending) |
| Schedule Performance Index | SPI | EV divided by PV (below 1 = behind schedule) |
Essential Formulas:
- BAC = Sum of all work package budgets
- EAC = BAC divided by CPI (when current performance is expected to continue)
- EAC = AC plus (BAC minus EV) divided by CPI (performance-based complete formula)
- ETC = EAC minus AC
- VAC = BAC minus EAC
- TCPI = (BAC minus EV) divided by (BAC minus AC)
Sample Exam Question 1:
A project has a BAC of $200,000. At the current reporting period, EV is $80,000 and AC is $100,000. What is the EAC?
CPI = 80,000 divided by 100,000 = 0.80 EAC = 200,000 divided by 0.80 = $250,000
The project is forecast to cost $50,000 more than the original BAC.
Sample Exam Question 2:
Your project’s BAC is $150,000 and it is currently 8% complete. The project manager wants to calculate ETC. Which formula is most appropriate?
At 8% complete, the project is still in the early stage (under 10%). The acceptable formula at this stage is ETC = BAC minus AC. Beyond 10%, switch to ETC = (BAC minus EV) divided by CPI.
Sample Exam Question 3:
A project manager updates the BAC without a formal change request because the project is running over budget. What is the main problem with this?
The performance measurement baseline has been corrupted. All historical EVM data is now incomparable to current data. CPI trends, variance analysis, and EAC forecasts are all unreliable going forward. Formal change control exists precisely to prevent this.
Knowing how to calculate budget at completion is not just exam knowledge. I have found that the PMs who truly understand BAC at this level tend to produce more trustworthy cost reports, have better conversations with stakeholders about budget health, and pass these exam questions without needing to memorize formulas they never understood.
Frequently Asked Questions About Budget at Completion (BAC)
Q: Does BAC include contingency reserves and management reserves?
No. BAC covers only the authorized operating budget for actual project work. Reserves sit completely outside of BAC and are only moved into the operating budget when formally approved through change control. This matters because if you include reserves in your BAC from the start, your CPI will look better than it really is and your EAC will paint a rosier picture than the project deserves.
Q: What is the difference between BAC and EAC in project management?
BAC is fixed. EAC moves. BAC is the original approved budget you set during planning. EAC is your running forecast of what the project will actually cost based on current performance. When EAC creeps above BAC, you have a projected overrun. The simplest way to calculate EAC in project management is BAC divided by CPI, though more complete formulas exist depending on what assumption you make about future performance.
Q: Can BAC change during a project?
Yes, but only through a formally approved change request. If scope changes and gets approved, BAC is updated to reflect the new work. What you cannot do is quietly revise BAC because you are over budget and want the metrics to normalize. That corrupts your cost baseline and makes every EVM report after that point unreliable.
Q: What formula should I use to calculate ETC from BAC?
It depends on how far along the project is. In the first 5 to 10 percent of completion, ETC = BAC minus AC gives you a quick approximation of remaining budget. Past that point, switch to ETC = (BAC minus EV) divided by CPI. The second formula accounts for how efficiently the project has been spending, which is information the simple subtraction ignores. If your plan has fundamentally fallen apart, skip both formulas and do a fresh bottom-up re-estimate.
Q: Is cost to complete the same as budget at completion?
They are related but they are not the same thing. In construction environments these terms sometimes get used interchangeably, which causes real confusion. BAC is the original total approved budget for all project work. Cost to Complete (also called Estimate to Complete or ETC) is the projected cost of only the remaining work from today forward. They connect through the formula ETC = EAC minus AC.
Q: Where does BAC appear on an EVM performance chart?
BAC is the endpoint of the Planned Value line on an EVM S-curve chart. Look at where the PV curve ends. The horizontal axis at that point shows the scheduled project completion date. The vertical axis shows the total authorized budget. That final point is your BAC. Every other curve on the chart, Earned Value and Actual Cost, is plotted in relation to it.
Q: What are the three methods for calculating BAC?
Bottom-up estimating, analogous estimating, and parametric estimating. Bottom-up is the most accurate because it builds the estimate from individual task costs using a Work Breakdown Structure. Analogous uses historical data from similar past projects and works best in early planning when you do not yet have a detailed scope. Parametric uses unit costs multiplied by quantities and is ideal for construction or any project with repeatable, measurable work. When accuracy matters, bottom-up is the one I reach for.